


This is the first part of a two-part series on ridehail drivers and robotaxis. Today’s issue is about who the ridehail drivers are, and how robotaxis will not affect them uniformly. Next week’s will be about determining what, if anything, the drivers are owed.
But before that, two administrative notes.
Firstly, I’m looking forward to the Progress Conference 2026, happening later this week (8–11 October 2026) at Lighthaven in Berkeley, California. On Friday evening I’ll be interviewing Dmitri Dolgov, co-CEO of Waymo, live on the main stage, followed by a book event, where I’ll be signing complimentary copies of my co-written book, The End of Driving. If you’re at the conference, I’ll have limited availability for meetings, though programming will take up most of my time. And if you’re not at the conference, fear not, the video of the interview should be available later this year.
Secondly, the Dais, Toronto Metropolitan University’s policy think tank and “Canada’s platform for bold ideas and better leadership”, has recently published a short piece from me on what it will take for robotaxis to arrive in Canada, and what citizens should expect of their governments in that regard. While it uses the upcoming mayoral election in Toronto as its frame, the essay will be useful to anyone thinking about robotaxi regulation in their own city. I hope you find it valuable.
Waymo approached Toronto City Hall this year to express interest in operating in the city. The mayor’s answer, delivered through her press secretary, was that she “will not support Waymo if it costs jobs, drives down wages for other workers, or contributes to precarious work in our city”.
Put another way, the mayor was saying that she won’t support Waymo if it means ridehail drivers do less work: if they give fewer trips, get paid less for the trips they do offer, or can’t count on ridehail work to make a living.
The problem here is that there isn’t one population of ridehail drivers, but two. One is large, drives a little, gives longer trips, and turns over quickly. The other is smaller, does most of the driving, gives short trips inside the city, and turns over more slowly. As robotaxis arrive, they’ll affect each population in different ways and at different times, and the group that relies on the work most is likely to feel it first.
And what that means is that good robotaxi policy needs to think clearly about each group, what distinguishes them, and only then about what they might be owed.
Importantly, I came to this data with a hypothesis I’ve held for some time, and advanced as an argument in some high-profile places: that turnover among ridehail drivers is so high that robotaxis could arrive without forcing many of them out.
Turns out, I was wrong.
The Casuals and the Core
Before we get into the specifics, let’s take a moment to discuss how we know there are two kinds of ridehail driver. The answer is that some cities are good about publishing data on the subject, which are readily available. Two of the richest are Chicago’s and Toronto’s, which record, respectively, every eligible driver’s trips each month and every ridehail car’s activity, hour by hour.
They aren’t directly comparable datasets, since Chicago’s tracks drivers while Toronto’s tracks vehicles, but they’re close enough to be useful. Researchers can supplement these with studies built on the records of New York’s taxi regulator, Minnesota’s labour department, the City of Seattle, and other places. For this analysis, I pulled the most recent full data for July 2026 in Chicago and for 2025 in Toronto. Of course, when I said I pulled them, I mean that my research assistant Claude did; it’s wonderful to live in a time when a project like this, which once would have required a team of academics, can be done by a solo writer and an AI assistant. I’ve listed the data and other sources I consulted at the end for anyone who wants to do their own analysis.
Of all these datasets, the best one to start with is Chicago’s. Helpfully, for any given month, Chicago lists every driver eligible to give trips at that time, and how many trips each one served. In July 2026, among drivers who gave any trips at all, the median driver provided 83. The median trip, though, came from a driver who provided 239.
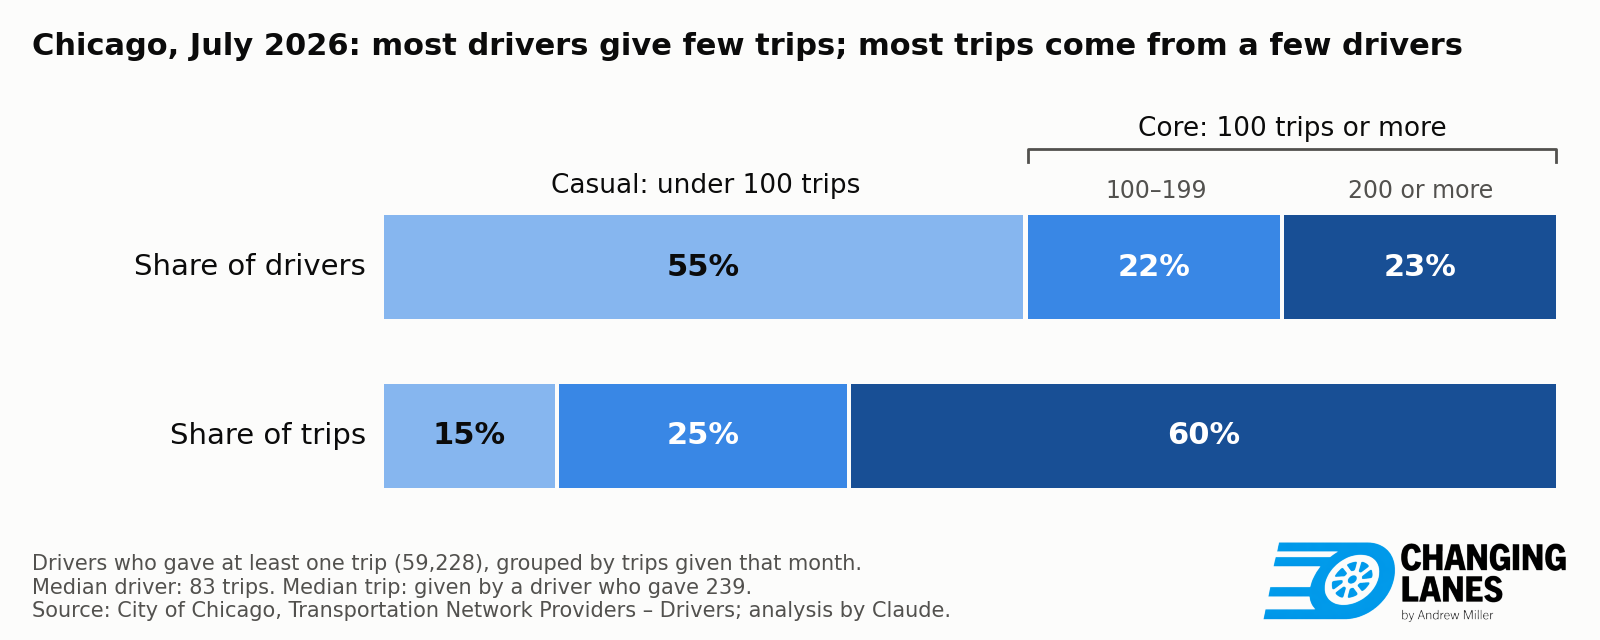
That’s quite a spread, and it tells us quite a bit.
The first thing it tells us is that most drivers work only a little, and that a minority of drivers are working a lot, so much so that they supply most of the trips. That’s because the spread is so wide. If it had been close together, that would suggest a homogeneous group, where all drivers are doing about the same amount of work. The wider the spread, the more heterogeneous the workforce must be, with a few drivers doing most of the work and many doing little. A gap of nearly three to one suggests the latter.
And that’s just counting drivers who gave at least one trip in a month. A third of the drivers on Chicago’s list gave no trips at all. It’s not clear how many of these are people who have left the ridehail platforms and not been purged from the rolls yet, but it doesn’t really matter: whether they have left the sector, or are still nominally in it but without participating in it, they aren’t doing any work. Among those who did drive, the 45% who gave 100 or more trips supplied 85% of the rides.1
And the skew may be higher than that, because there are two classes of error in the dataset that each pull in the same direction. Firstly, the dataset blanks trip counts above 999, so the most Stakhanovite drivers, 55 of them in July, drop out of the tally altogether. Secondly, the City tries to merge the records of a driver working for more than one company at once, but can’t always do so. So in at least some cases, a driver working two apps appears as two light drivers rather than one heavy one. Both errors mean the busiest drivers are, if anything, busier and more numerous than the numbers show.
The pattern recurs beyond Chicago. Everywhere else one looks, in Toronto, New York, Minnesota, and Seattle, most of the driving is being done by a minority of drivers.
Any line we draw will be arbitrary, so let’s choose a nice bright one. How about 200 trips a month? That level of provision is roughly equivalent to working full time: the median Toronto car giving that many is logged in to the app for 35 to 40 hours a week, waiting included. Hold on, though; driving ridehail is famously a ‘gig economy’ job. So 200 is too high. Splitting it in half is 100 trips a month, consistent with a solid part-time job. Let’s draw our bright line there. Those who do less than that we will call casual drivers and those who do that or more core drivers: people for whom driving is likely a principal source of income, if not their only one.
Let’s take what we’ve learned from Chicago and add data from Toronto. Toronto’s open data follows each car from month to month. That’s not quite the same as following a driver: Toronto doesn’t record driver names, and a licensed car could be worked by more than one. But we do know that, unlike the old taxi medallions, licences are not difficult to get, so the incentive to split cars is weak. Indeed, Young, Farber and Rahman found that only 11% of Toronto ridehail vehicles were associated with more than one driver (though 24% of drivers use more than one vehicle).
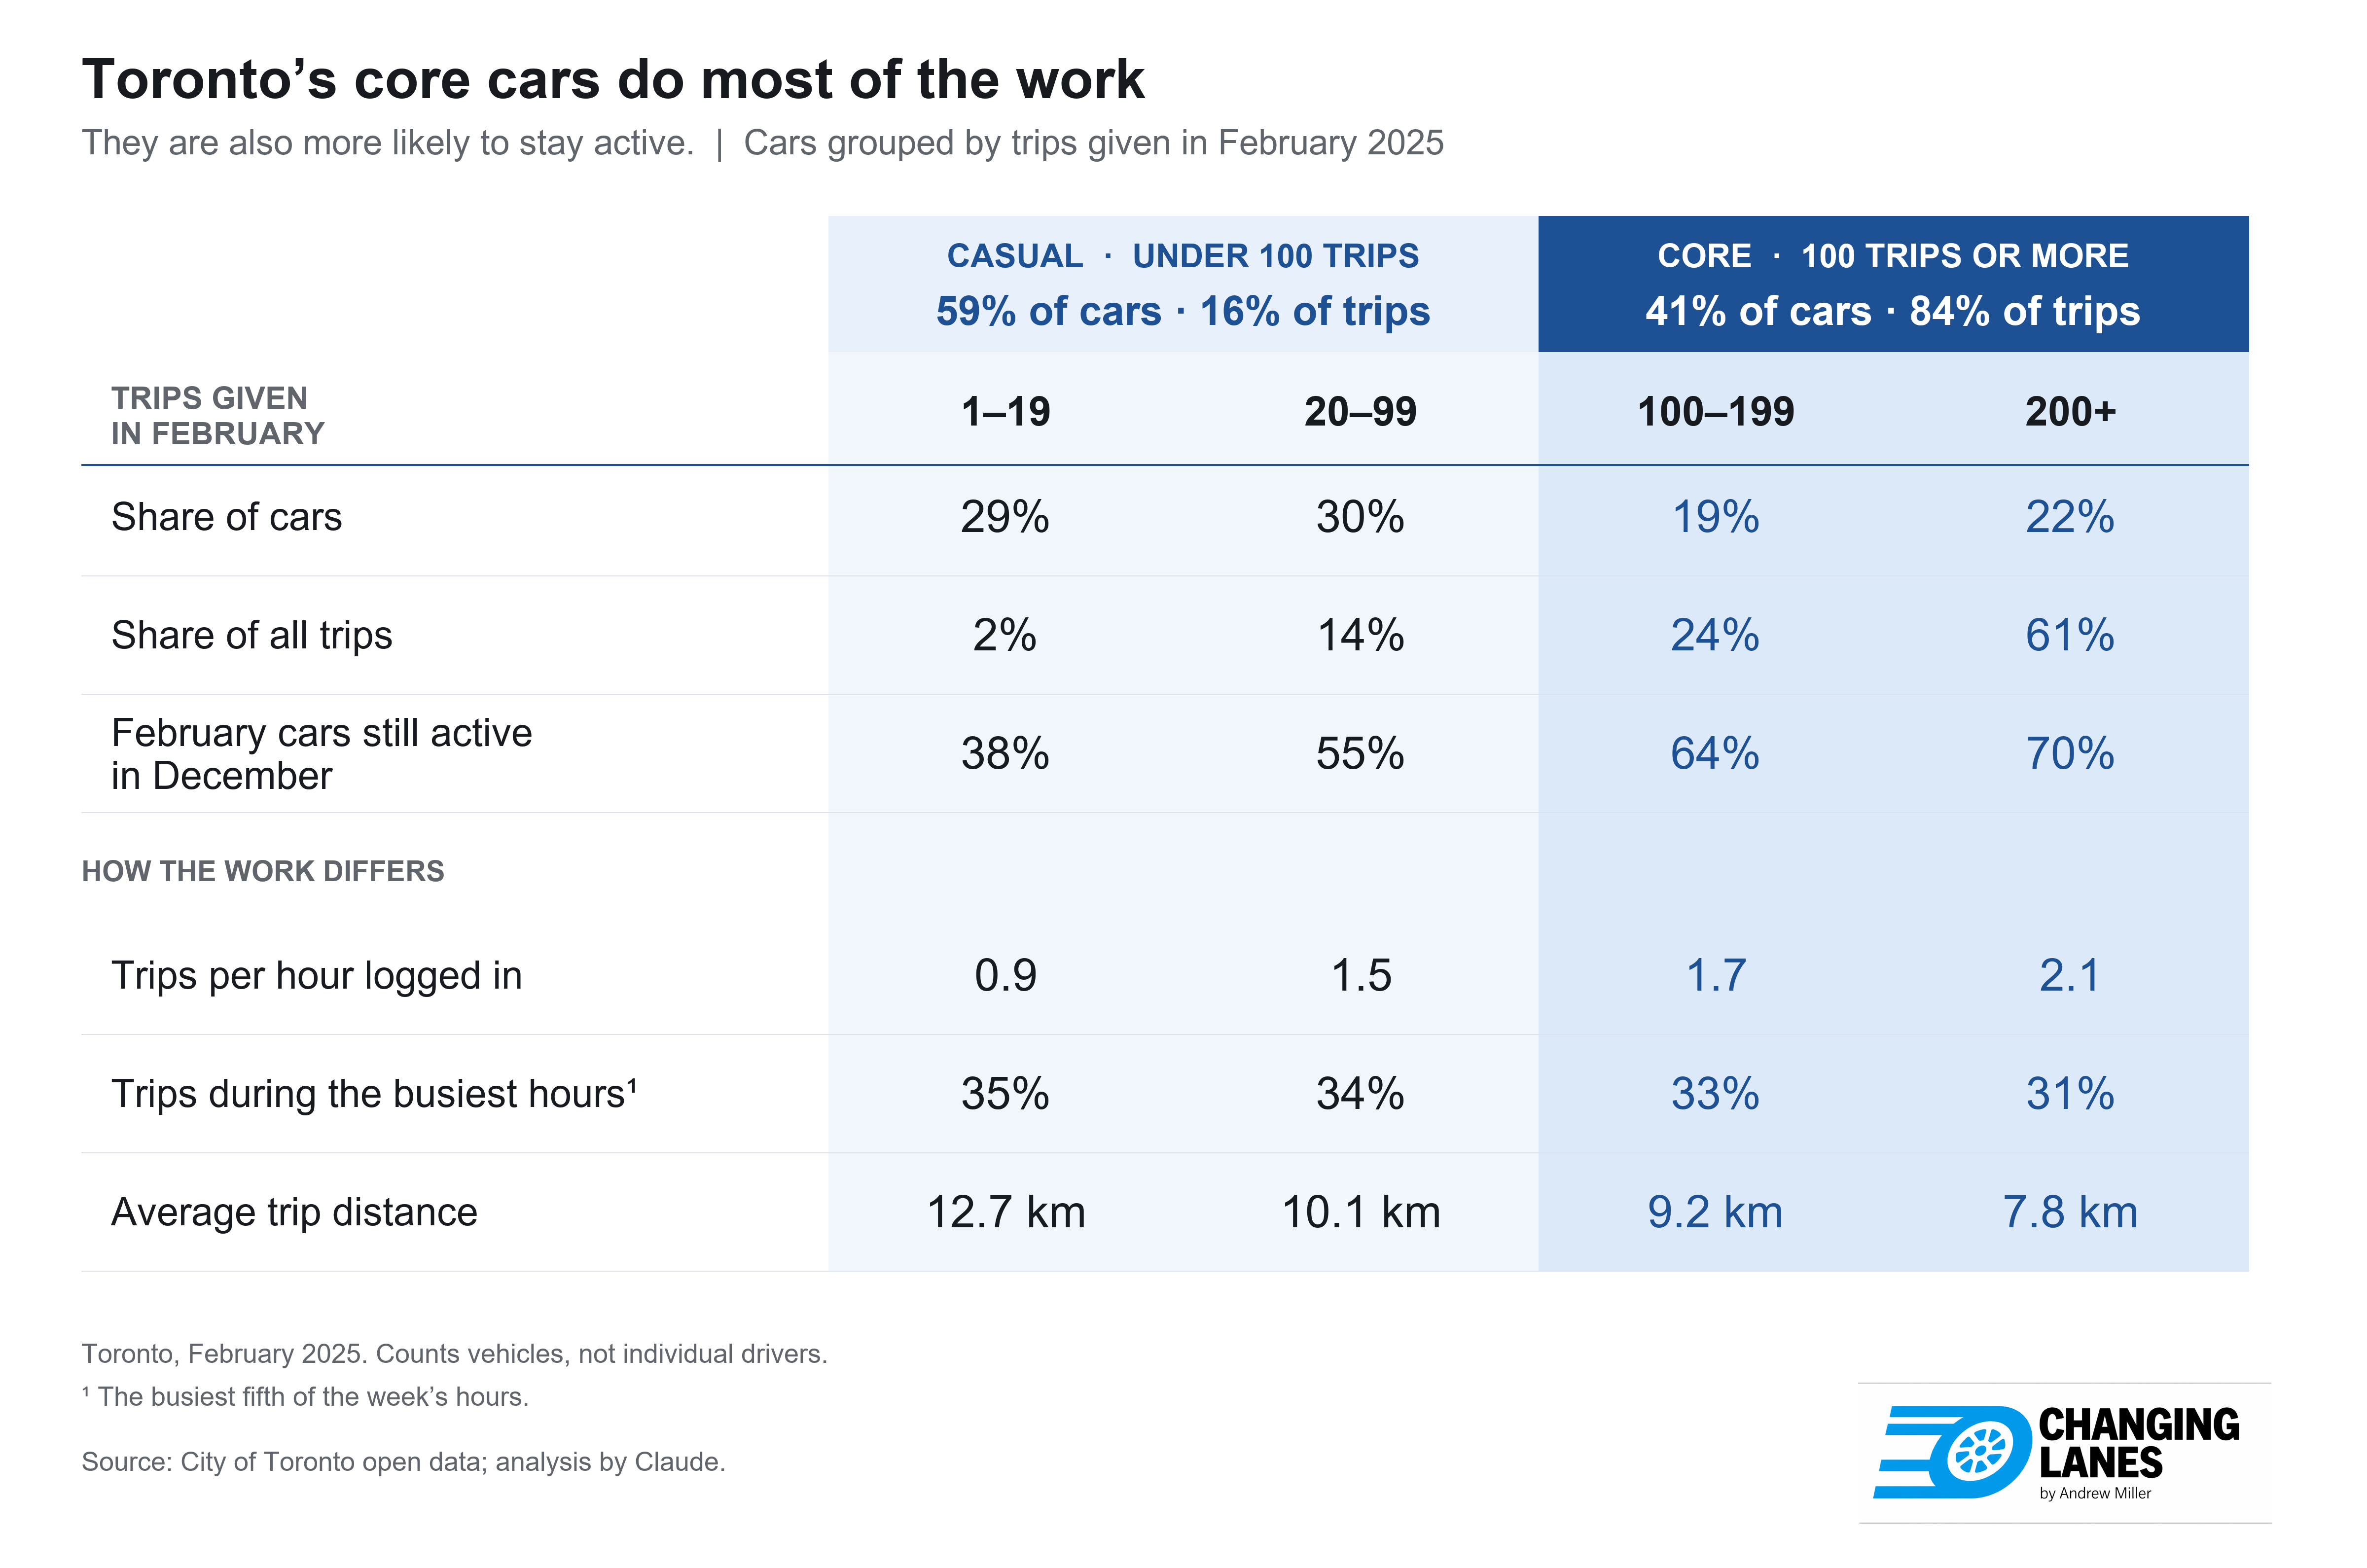
So let’s assume that cars track drivers closely enough to do some analysis, and consider what was happening in Toronto between February and December of 2025.
Source: City of Toronto open data
Casuals Peel Away and the Core Remains
Most people who start driving ridehail don’t stay. Of the Chicago drivers who started in January 2025 and were giving trips by February, only a third were still giving trips six months later. After a year, their numbers had more than halved again, to 15%; after eighteen months, only 11% of them were still driving. I have argued before that the gig model runs on burning through a constant supply of new entrants; this is new evidence for that argument.
But while casual drivers giving few trips fall away, core drivers giving lots of them stick around. In Toronto, 70% of the busiest cars in February were still working in December, against 38% of the lightest. Taking the two groups as a whole, 67% of core cars were still working, against 47% of casual ones.
So the drivers who stay are doing most of the work. But which way does the arrow of causation run? Does driving a long time get you more trips, or does providing more trips encourage you to keep driving?
The evidence suggests the latter. If driving a long time got you more trips, veterans would be busier than newcomers, and they aren’t: in Chicago in July 2026, drivers who had started two or more years earlier were about a third of active drivers, and they gave about a third of the trips.2
So core drivers drive a great deal, and casual drivers hardly at all. That makes sense: surely the casual drivers log in during peak or surge periods to capture high-value work when it’s easy to get, then log off again. That’s what we would expect the gig-economy frame to encourage.
That’s a natural guess, but it appears to be wrong. Toronto’s data suggests that the weekly peaks—weekday rush hours and Friday and Saturday evenings—take up about a fifth of the week’s hours but a third of all the week’s trips. If our guess were true, casual drivers would give a much bigger share of their trips in those hours than core drivers do. But we don’t see that. Each group gives about a third of its own trips in those hours: 35% for the lightest cars, 31% for the busiest.
What distinguishes the two groups is the kind of trip they offer, not when they offer it. The busiest cars stick to the densest part of the city and give short trips: 7.8 km (just under five miles) on average, with only a quarter of their trips coming in hours when the car crossed the city line. The lightest cars average 12.7 km (just under eight miles), and about two-thirds of their trips come in hours when the car crossed the city line: runs to and from the suburbs and to Pearson Airport (also in the suburbs). Consequently, casuals are pulling in fewer fares, but each fare tends to be bigger: $22.26 on average for the lightest cars against $17.98 for the busiest (all figures for Toronto in CAD).
Trading My Time for the Pay I Get
Is driving ridehail a good way to make a living? Judging only by pay, no.
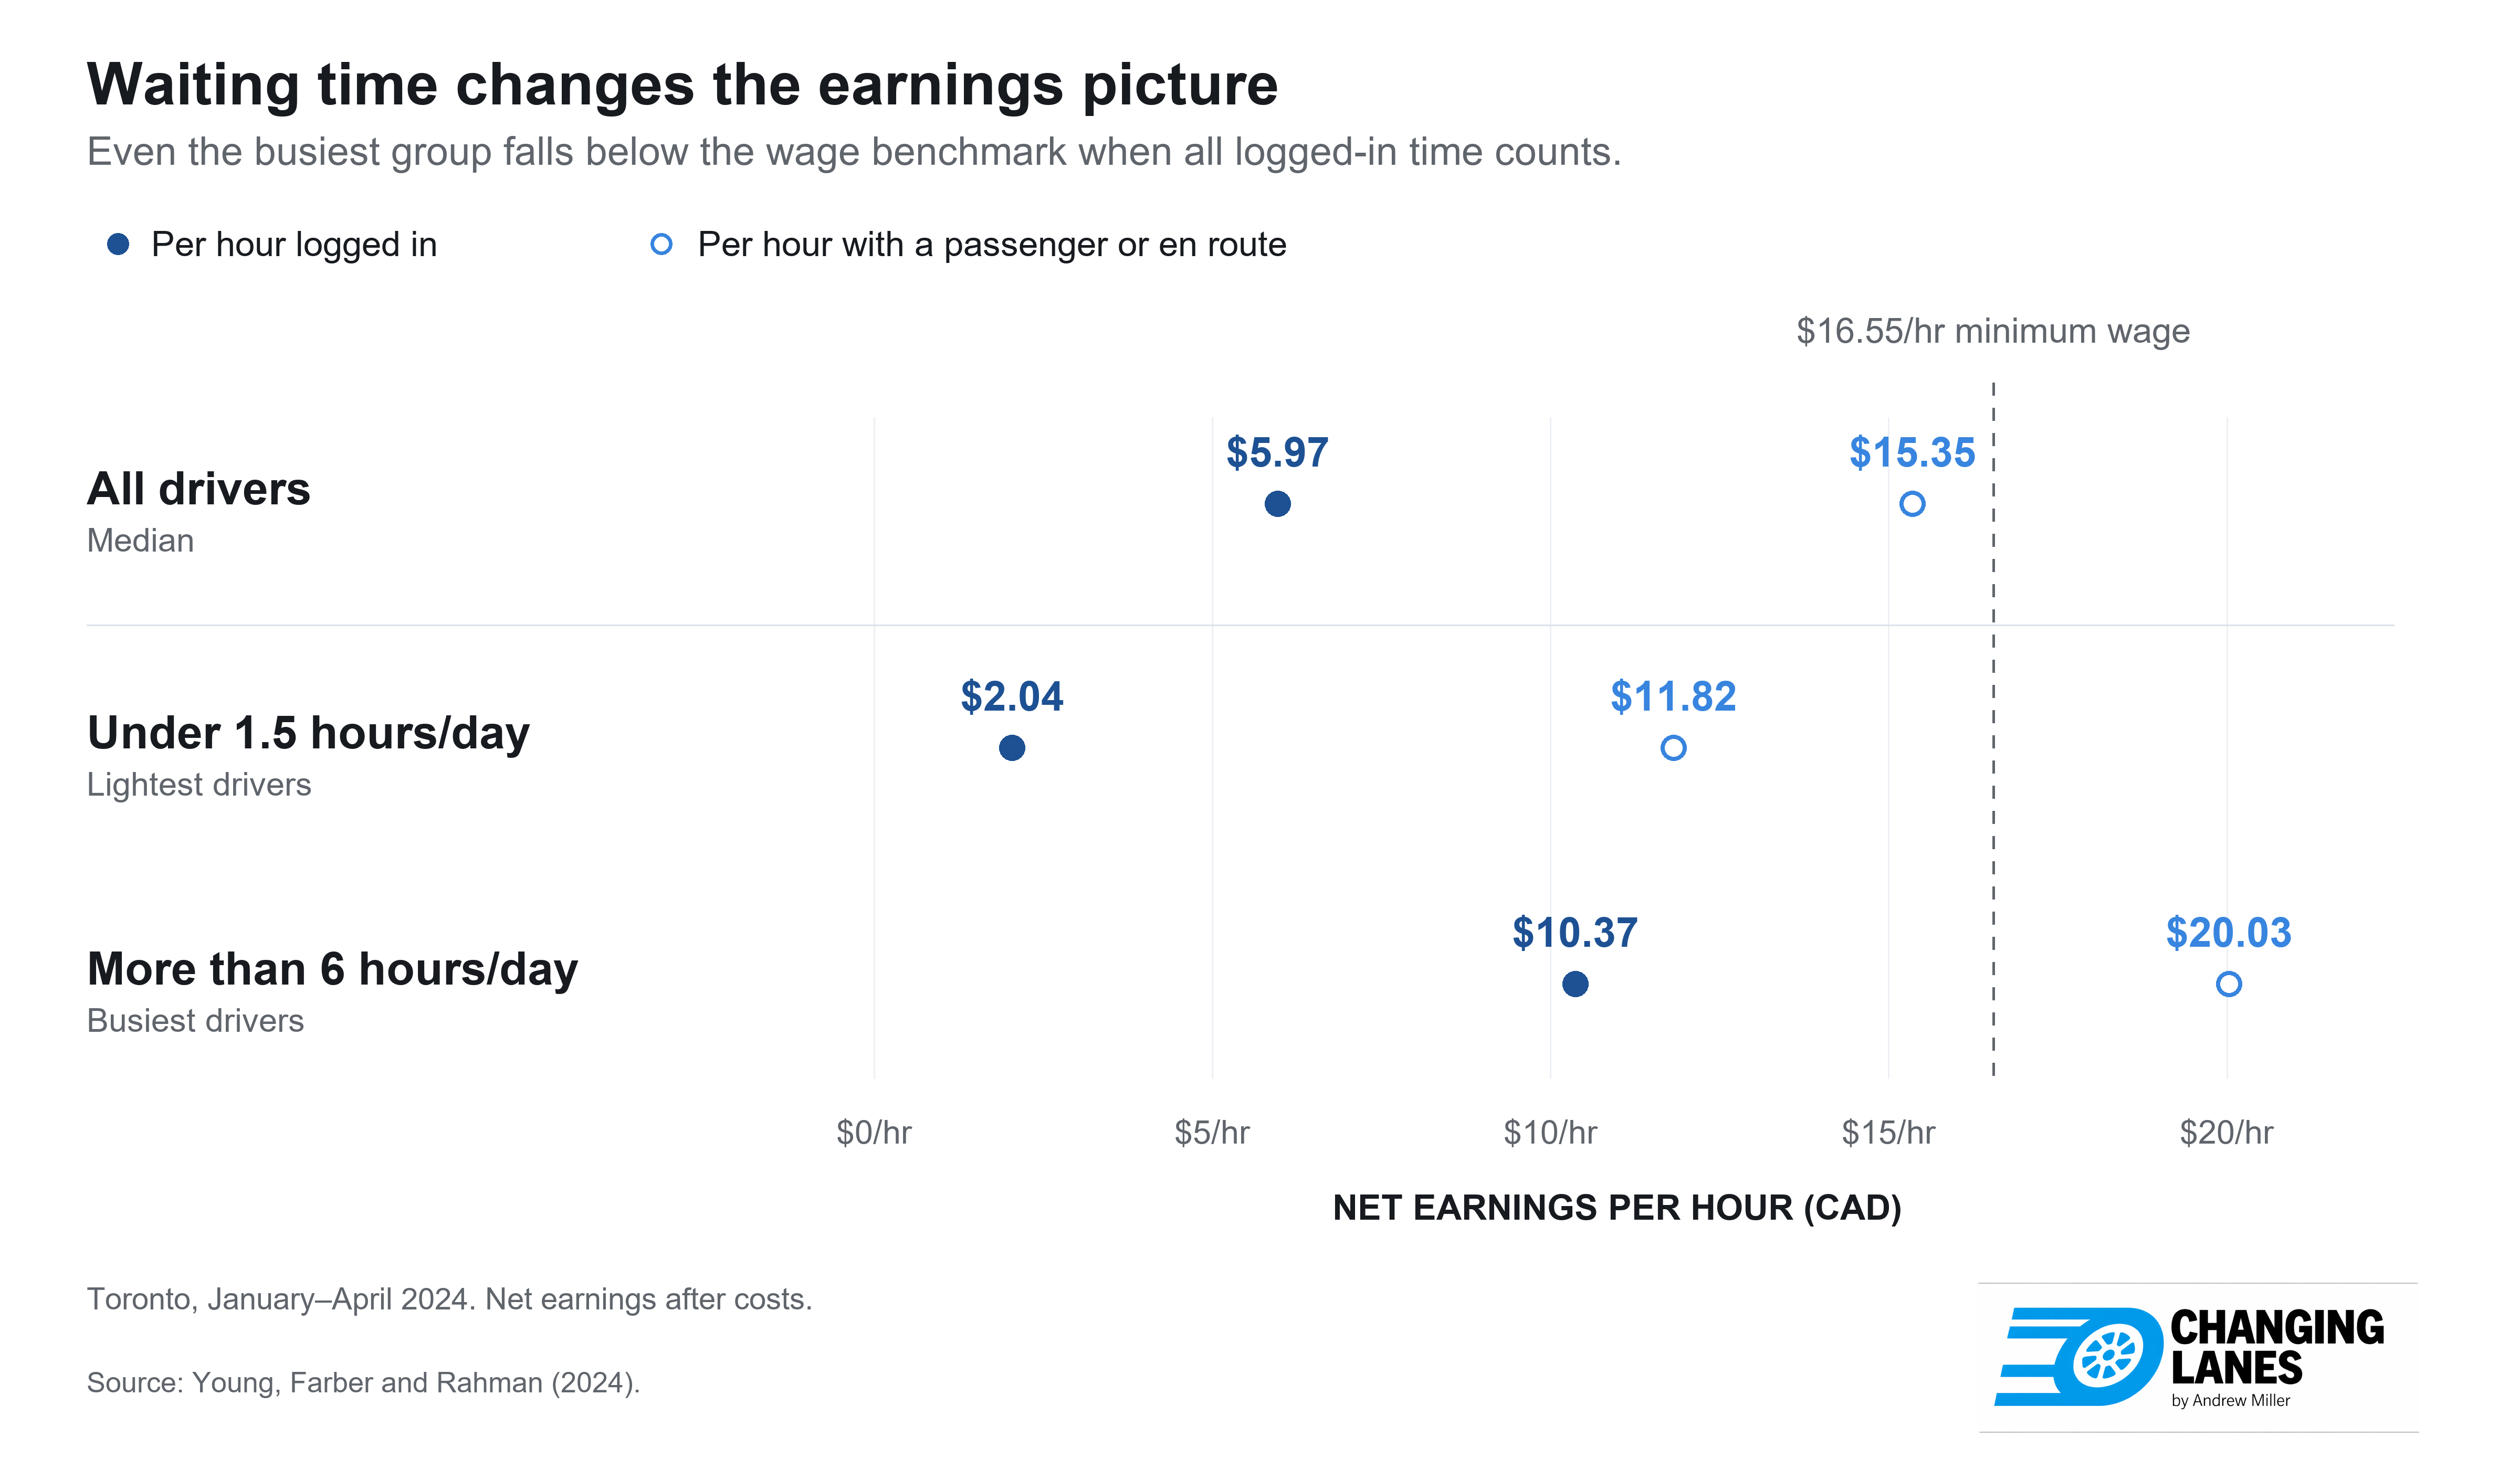
In Toronto, between January and April 2024, the median driver netted $15.35 for each hour with a passenger or on the way to one, against a minimum wage of $16.55. Crucially, though, that counts only hours with a passenger or on the way to one, and those are comparatively few. Dividing driver pay by hours spent logged into the ridehail app yields just $5.97 an hour.3
As the gap suggests, drivers spend most of their time waiting for customers. In Toronto, they’re waiting more than they used to: deadheading rose to about 48% of in-app time by 2025, from 36% in 2022.
Of course, as we’ve seen, most drivers drive very little. So that $5.97 per hour represents the median driver, but we should decompose it. Split by hours logged in a day, the lightest drivers, on for under an hour and a half, netted $2.04 per logged-in hour and $11.82 per hour with a passenger; the heaviest, on for more than six hours, made $10.37 per logged-in hour and $20.03 with a passenger, comfortably clearing the minimum wage. So to ask what a driver earns misleads: it depends very much on what kind of driver they are.
Source: Young, Farber and Rahman
Surprisingly, how far core drivers depend on driving for their living has been measured only once. That was in Seattle in 2020, where 72% of full-time drivers said driving was their only income, against 19% of those driving under 20 hours a week.4
It would also be helpful to know if core and casual drivers differ in demographics, but data on this is also scant. Nobody anywhere tabulates national origin, ethnicity, nor age by how much people drive, so if there are meaningful distinctions between these groups in this regard, we can’t yet speak to them.
Which Drivers’ Jobs?
Go back to the mayor’s condition. She won’t support Waymo if it costs jobs, drives down wages or makes work more precarious. The data tells us how to reply: Whose jobs? Whose wages? And whose work?
Illustration by ChatGPT
If we count by people, we see that most ridehail drivers are casuals, for whom driving is a supplement they take up and drop within months. If we count by the work being done, most of it is done by core drivers. These are fewer than half of those driving in a given month, but giving more than four-fifths of the trips, and likeliest to be still driving ten months later.
It would seem that the group that is adding value, and the group that deserves protection, are the core drivers; the casual drivers need the work less and drift away on their own. Which is a good finding! Let the robotaxis come, outcompete the casuals, and complement the work of the core drivers. There’s no trade-off that needs to be made!
That is an argument I have made before. In The Hub in June, I wrote that because the sector “already sees annual turnover of 50 to 100 percent”, natural attrition “will absorb most of the transition without anyone being forced out”. I made the same case about Seattle, and spoke to it on the Omnibus podcast.
Unfortunately, having looked further into the data, I now see that the case I made appears to be dead wrong. Turnover is high among casual drivers, but the core, who do most of the work, stick around. When the robotaxis come, it’s the core drivers they are likely to outcompete first.
Inside Waymo’s service areas in San Francisco, Los Angeles and Phoenix, robotaxis already take about 15% of what riders spend on ridehail trips. Those service areas start inside the city, and airports and suburbs come late. Waymo, for example, began fully driverless rides in parts of San Francisco in late 2022, but reached San Francisco International Airport only in January of this year. The short trips inside the city that fill a core driver’s week will be taken by robotaxis first. The long runs out to the suburbs and the airport, which lean casual, are among the last.
What that means is that the robotaxis are coming for the people who need the work the most. How will that play out? And what do the cities where they work, or the robotaxi companies that are drinking their milkshake, owe them? The answer might be the same thing that ridehail companies owed the taxi drivers they outcompeted 15 years ago: nothing. But perhaps the circumstances are different enough that a better answer is required.
I once wrote that if the net result of robotaxis is to impoverish the Uber drivers, we’ve failed. So will that happen, and if so, what’s the alternative? That will be the subject of our next issue.
Respect to Jannik Reigl and Mike Riggs for comments on earlier drafts.
Data and sources
Data
City of Chicago, Transportation Network Providers – Drivers, July 2026, and the drivers who started in January 2025, followed to August 2026; pulled September 2026
City of Toronto, Private Transportation Companies – Vehicle Operating Data, all of 2025; downloaded September 2026
Studies and reports
Koustas, Parrott and Reich, New York City’s Gig Driver Pay Standard (2020)
Parrott and Reich, Transportation Network Company Driver Earnings Analysis and Pay Standard Options (Minnesota) (2024)
Parrott and Reich, A Minimum Compensation Standard for Seattle TNC Drivers (2020)
Young, Allen and Wang, How Much Ridehail Travel Is Deadheading? (Toronto) (Findings, 2026)
Young, Farber and Rahman, On the Road: Analysis of Driver Earnings in Toronto’s Vehicle-for-Hire Industry (2024)
YipitData estimates of Waymo’s share of ridehail spending (via Business Insider, 2026)
The 100-plus band is 26,708 of 59,228 active drivers, giving 6,404,985 of 7,532,921 trips. The top tenth of active drivers gave 34 per cent of the trips; as noted, that’s a floor rather than a ceiling because the dataset blanks counts above 999.
From the City’s refresh of 23 September 2026: 18,841 of 59,234 active drivers, giving 2,529,599 of 7,537,378 trips.
As was the case in Chicago, Toronto’s data team attempted to remove time logged into more than one app at the same time. As of 1 July 2025, Ontario requires that drivers receive a pay floor of minimum wage, but that applies to time on assignments only, leaving waiting unpaid. These figures describe the period before the province acted, meaning things have improved for drivers… but only slightly, given the paucity of hours on assignment.
Full time there means 32 hours a week or more. The question asked about personal, not household, income.